As embedded systems grow more powerful and heterogeneous, the interface between FPGA, hardware, and software becomes a critical fault line. Miscommunication across this boundary can result in elusive bugs, spiraling debug cycles, and costly delays.
From signal integrity to distributed architectures, we’ll break down the tools, techniques, and team strategies that lead to faster resolution and more resilient systems.
Understanding FPGA-Software Boundaries
Modern embedded systems are no longer neatly divided into hardware and software silos. Instead, they function as tightly integrated ecosystems where firmware, operating systems, real-time code, and FPGA logic interact across complex interfaces. This fusion creates unique challenges when something goes wrong.
At the heart of the issue is the hardware-software boundary, where timing, signaling, and functional expectations must align precisely. Unlike software debugging, where stack traces and breakpoints are commonplace, FPGA behavior is often invisible without specialized tools. Unlike FPGAs, where deterministic logic rules, software systems may introduce nondeterminism through threads, interrupts, or OS latencies. These divergent paradigms complicate root cause analysis.
Worse still, FPGA and software teams often work in parallel with limited insight into each other’s environments. Misaligned assumptions about protocols, initialization sequences, or signal behavior can go unnoticed until integration, when timelines are tight and debug bandwidth is limited.
The consequences are tangible: missed deadlines, performance bottlenecks, even product recalls. Fidus has seen projects derailed by simple oversights at this boundary, like an inverted handshake signal or a timing misalignment in DMA initiation. By recognizing the FPGA-software boundary as a critical interface—not just a handoff—teams can avoid integration fire drills and build more predictable systems.
First-Time-Right Approach to FPGA-Software Debugging
In complex embedded systems, debugging isn’t just a post-development activity—it’s a design-time discipline. At Fidus Systems, we advocate for a “first-time-right” approach: an engineering mindset that prioritizes architectural correctness and proactive validation from day one. When executed properly, this reduces time spent tracking elusive bugs after integration and accelerates time-to-market.
The cornerstone of this approach is early co-simulation and architectural alignment. Too often, hardware and software are designed in isolation, only to collide during system bring-up. Instead, Fidus emphasizes collaborative architecture sessions, ensuring both domains share a unified understanding of interfaces, protocols, and timing expectations. This mitigates costly rework caused by mismatched assumptions.
Early integration testing is equally critical. Rather than waiting for full-feature builds, teams should use lightweight, functional stubs and test harnesses to exercise hardware-software handoffs incrementally. These may include simulated drivers, RTL-level emulation, or even loopback firmware that mimics real-world conditions. By testing these interactions in isolation, you reveal errors in signal behavior, handshaking logic, or memory access patterns before they metastasize.
Fidus also builds comprehensive test environments that validate both domains in tandem. This includes synchronized waveform capture, dual-domain logging, and event alignment tools. A bug that appears “software-side” may in fact originate from a protocol stall in the FPGA, and vice versa. Only with shared context and tooling can these subtle errors be isolated quickly. A properly designed architecture, combined with layered integration testing, acts like a pressure release valve: it prevents cascading issues when new features are added or latent bugs surface.
With the first-time-right approach, debugging becomes less about firefighting and more about refinement.
Essential Tools for Cross-Domain Visibility
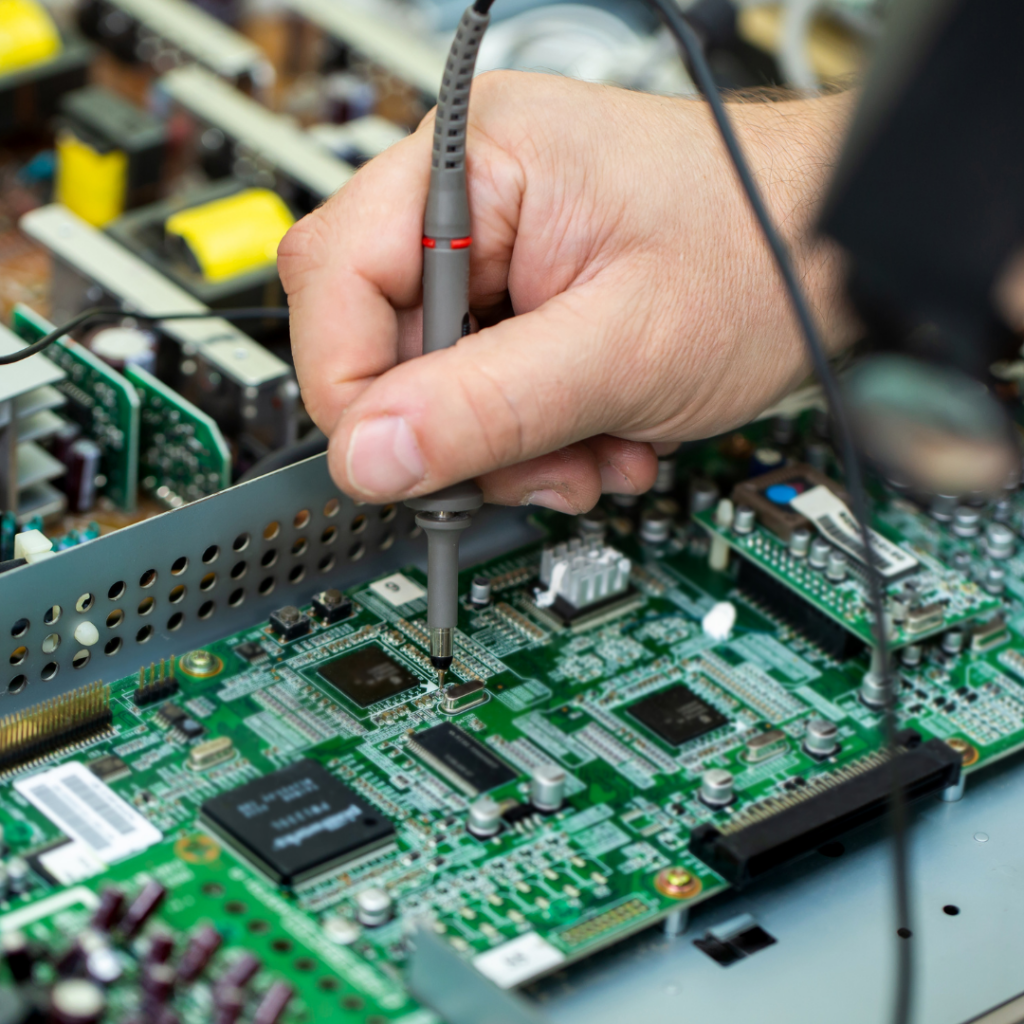
One of the biggest obstacles in debugging FPGA-software systems is a lack of shared visibility. Hardware engineers live in waveforms and logic analyzers. Software developers rely on logs and breakpoints. When something breaks at the interface, neither side may have the full picture, especially when timing-sensitive behavior only manifests under real-world conditions.
To bridge this gap, Fidus leverages a suite of cross-domain debugging tools that correlate hardware and software activity on a unified timeline. Built-in FPGA debuggers are invaluable for capturing internal signals without modifying the board. These tools can tap into buses, control signals, and state machines, revealing what’s happening inside the silicon.
However, they have limitations. These debuggers consume FPGA resources, which may be scarce in production designs. They can also struggle to capture long-duration behaviors or multi-domain timing misalignments. That’s why we pair them with software-side logging frameworks designed to emit timestamped events with microsecond precision. These logs, aligned with hardware captures, can trace signal transactions across both domains.
Even more powerful is the use of synchronized debug instrumentation. This includes shared timers, GPIO-based debug signaling, and high-resolution timestamping on both FPGA and processor domains. By aligning these signals in post-analysis tools, Fidus engineers can trace how a configuration register writes propagates through the fabric and ultimately affects system behavior.
In some systems, logic analyzers and high-speed oscilloscopes can be tapped in for external correlation. When combined with internal monitors, this creates a multi-layered view of system health, crucial for diagnosing race conditions, metastability events, or misfiring DMA engines.
Without synchronized visibility, debugging is like watching a movie with half the frames missing. With the right tools, cross-domain bugs go from mysterious to manageable.
Mastering Timing-Related Bugs at the Interface
Some of the most insidious bugs in FPGA-software systems stem from timing, not logic. At the interface where hardware and software meet, nanosecond-level timing mismatches can produce intermittent, nondeterministic failures that defy traditional debugging techniques. These are the bugs that work “on your desk” but break in the field.
One common culprit is improper clock domain crossing (CDC). FPGA designs often contain multiple clock domains—for example, a fast transceiver clock and a slower system control clock. When software initiates an event that relies on a signal crossing between these domains (such as triggering DMA), incorrect synchronizer design can lead to metastability, data corruption, or lost events. These issues may only surface under certain load or temperature conditions, making them difficult to reproduce.
To catch these, Fidus employs both CDC static analysis tools and runtime observability logic. It’s critical not only to detect unsafe crossings during synthesis but also to monitor handshake signals live in hardware to ensure protocol compliance.
Another category of timing bugs arises at high-speed interfaces—PCIe, JESD204B, Ethernet, or custom serial links. These interfaces rely on precise alignment, skew control, and deterministic latency. When the software initiates a transaction, such as writing to a memory-mapped register or polling a status bit, even slight timing variations in link training or frame alignment can cause the system to hang or return stale data.
Fidus combats this by incorporating interface diagnostics directly into the FPGA design: counters, aligner status flags, CRC monitors, and internal state machines expose interface health to software in real time. On the software side, carefully tuned polling loops, retry logic, and timeout schemes prevent lockups due to transient desynchronization.
Ultimately, timing bugs require a systems-level mindset. FPGA and software engineers must collaborate to define timing expectations, capture deviations, and build resilience into every handshake. When timing is treated as a first-class design constraint, not a downstream concern, systems become dramatically more robust.
Signal Integrity: The Hidden Culprit
Sometimes, what looks like a software bug is actually a physical-layer problem in disguise. In complex systems, signal integrity (SI) issues can manifest in ways that confuse even seasoned developers. Register reads return incorrect values, packets drop sporadically, or an interface inexplicably fails at higher clock rates. Debugging these symptoms purely in the digital domain leads nowhere because the root cause lies in the analog world.
At Fidus, we’ve encountered numerous projects where subtle SI problems masqueraded as software faults. A classic case: a memory-mapped peripheral intermittently returned corrupted data. The software team assumed a race condition or cache coherency bug. After exhaustive analysis, the root cause turned out to be reflections on a poorly terminated PCB trace between the FPGA and peripheral—a physical issue, not a logic one.
S-parameter analysis is essential for uncovering these ghosts. Using tools like Keysight ADS or Anritsu Vector Network Analyzers, engineers can evaluate transmission line characteristics, measure impedance mismatches, and assess return loss across high-speed nets. When combined with eye diagrams and bit error rate testing, these methods reveal whether signals are actually reaching the FPGA as expected.
Even low-speed signals can suffer from SI degradation, especially when long traces, multiple stubs, or poor ground referencing are involved. Clock lines, chip-select signals, and control buses may look “fine” in a simulation but behave erratically under EMI stress or marginal power supply conditions.
That’s why Fidus integrates early-stage SI review into board layout and routing decisions. We also instrument test builds with probing points and optional termination networks to facilitate real-world validation.
Most importantly, we train both software and FPGA engineers to recognize when a “digital” failure might have an analog origin. By adopting a signal-integrity-aware debugging posture, teams can prevent weeks of wasted effort chasing phantom bugs—and ensure that the hardware foundation is solid before the software stack is built.
Debugging Distributed FPGA Systems
As systems scale in complexity, it’s increasingly common to find multiple FPGAs deployed across boards, chassis, or even geographically distributed nodes. These distributed architectures enable powerful parallelism and functional segregation, but they also introduce a host of new debugging challenges.
First, errors in distributed systems are often nondeterministic. An issue may appear on one board but not another, or only occur under specific data flow conditions. Temperature fluctuations, jitter accumulation, or inconsistent initialization sequences can produce elusive bugs that resist local reproduction. Traditional step-through debugging fails here—not because the tools are inadequate, but because the system’s behavior changes every time it runs.
Fidus addresses this challenge with a layered strategy. We embed timestamped error detection logic in every FPGA, enabling us to track when and where anomalies occur, without relying on external probes. This can include CRC checkers, watchdog timers, FIFO overflow indicators, and event counters synchronized to a common time base across FPGAs. These embedded monitors act like black box recorders, preserving evidence of the system’s last known good state before failure.
Second, communication between FPGAs—over links like LVDS, Aurora, or Ethernet—must be validated as rigorously as internal buses. Protocol mismatches, framing errors, or link retraining glitches can be mistaken for functional bugs. Fidus builds custom self-test protocols and loopback modes that exercise inter-FPGA links independently of higher-level functionality. This isolates the physical and link layers from logic-level concerns.
Finally, orchestration of distributed systems is key. If one FPGA initializes before another is ready, handshake mismatches can occur. If interrupts or status flags are not properly propagated, the system state can drift. To counter this, Fidus implements phased boot sequences, heartbeat monitors, and system state machines that provide coordination guarantees, even under fault conditions.
Debugging distributed systems demands more than better tools—it requires a systemic approach to observability, synchronization, and fault isolation. With these capabilities embedded from the start, even the most complex multi-FPGA architectures can be debugged predictably and efficiently.
Optimizing the Debugging Process: Moore’s Law of Errors
There’s an unspoken rule in complex system development: each successive bug takes about twice as long to identify and fix as the one before it. At Fidus, we call this the “Moore’s Law of Errors.” It’s not a law of physics, but it might as well be. As development progresses and bugs become less obvious, debug time increases exponentially unless the process itself is optimized.
This phenomenon has a few root causes. Early bugs tend to be structural—missing connections, incorrect register maps, or obvious logic errors. But as the system matures, remaining issues are subtle: intermittent timing problems, edge-case state transitions, or multi-domain race conditions that surface only under full system load. These bugs often masquerade as anomalies, requiring deep correlation across multiple layers to diagnose.
To combat this, Fidus applies a triage-driven debug methodology. Instead of chasing every issue linearly, we prioritize based on severity, reproducibility, and system impact. For example, a crash in a test environment may take precedence over a UI glitch, even if the latter is easier to fix. This prioritization ensures the team’s time is spent where it delivers the most value.
Just as important is statistical instrumentation. We advocate embedding error counters, watchdog triggers, and anomaly logs throughout the FPGA and software layers. These aren’t just for diagnostics—they’re breadcrumbs that make it easier to understand what happened after the fact. Over time, they also help teams recognize patterns and anticipate fault conditions before they escalate.
Finally, we maintain a continuous debug logbook—documenting known issues, test results, environment details, and temporary workarounds. This institutional memory ensures that time isn’t wasted rediscovering old problems or duplicating effort across teams.
Debugging complex systems is a marathon, not a sprint. But by prioritizing intelligently, measuring comprehensively, and tracking systematically, teams can bend the Moore’s curve—and ship stable systems without slipping deadlines.
Best Practices: Building Debugging into Development Culture
Debugging isn’t just a technical task—it’s a cultural practice. In high-performing engineering teams, it’s baked into every phase of development, not reserved for when things break. At Fidus, we’ve learned that systems become easier to debug when debugability is designed in from day one.
This starts with how teams are structured. The traditional division between FPGA and software teams can create siloed thinking and missed context. We advocate for cross-functional squads that include expertise from both domains, enabling collaborative problem-solving and shared accountability. When software engineers understand FPGA timing constraints and hardware engineers grasp driver architecture, bugs are diagnosed faster, and fewer assumptions go unchecked.
Synchronized development milestones also play a key role. Rather than handing off the FPGA “when it’s done,” teams should plan integration checkpoints where both domains test their components together, even before final functionality is ready. These touchpoints create a rhythm of early feedback and reduce the risk of catastrophic late-stage surprises.
Another essential practice is designing observability into the system. Every major component—whether hardware or software—should include diagnostic hooks: test points, status registers, debug messages, even mode switches that expose internal state. These features should be part of the spec, not bolted on as an afterthought. The goal is to make it easy to ask, “What’s happening right now?” and get a meaningful answer without invasive probing.
Code reviews and design reviews should also include debug-readiness criteria. Are signals routed to accessible pins for probing? Are there registers that expose internal counters or fault states? Is the firmware prepared to log timing metrics or memory usage? By treating these questions as first-class design requirements, teams create systems that are far easier to validate, maintain, and evolve.
Ultimately, the most efficient debugging happens upstream—in the decisions that make systems transparent, testable, and modular. When a development culture embraces that mindset, bugs don’t stand a chance.
Future Trends in FPGA-Software Debugging
The future of debugging lies in automation, abstraction, and intelligent systems that assist developers long before bugs reach production. As FPGA-software systems grow more complex, traditional trial-and-error debugging is no longer sustainable. Fortunately, emerging tools and methodologies are poised to transform how we approach the problem.
One of the most promising developments is the rise of machine learning-assisted root cause analysis. These systems analyze logs, signal traces, and historical bug data to identify patterns humans might miss. Instead of starting every investigation from scratch, engineers get ranked hypotheses and guided workflows, cutting debug time dramatically. While still in its early stages, Fidus expects these capabilities to become integral in future design environments.
Virtual prototyping is another game-changer. With tools like QEMU, Renode, and vendor-specific simulators, it’s now possible to simulate large portions of a system—including the software stack—before physical hardware is ready. These platforms allow early firmware bring-up, interface emulation, and even fault injection to validate system behavior under corner cases. By the time real silicon arrives, most bugs are already flushed out.
Then there’s the trend toward unified debug frameworks—toolchains that span hardware and software, offering synchronized visibility and interactive control. These systems combine waveform viewers, software log analyzers, and time-correlated dashboards that allow developers to trace bugs across domains with minimal friction. They reduce reliance on tribal knowledge and empower junior engineers to navigate cross-functional problems with confidence.
Finally, the increasing accessibility of FPGA-as-a-service and cloud-based test environments enables parallel testing at scale. Engineers can now spin up multiple testbeds, run fuzzing campaigns, or replay fault scenarios across versions—all without monopolizing bench hardware.
The bottom line? Debugging is evolving from an art to a science. As tools become more predictive and integrated, developers will spend less time staring at logs and more time building resilient, high-performance systems. Fidus is committed to staying at the forefront of that evolution, helping teams solve not just the bugs of today, but the ones they haven’t seen yet.
Ready to Build for What’s Next?
📩 Get in touch with our team 📚 Or explore more insights in our Blog Hub
Hardware-Based Security for Embedded Systems: Exploring Trusted Platform Modules (TPMs)
As embedded systems become more connected and exposed to cyber threats, software-only security is no longer enough. Trusted Platform Modules (TPMs) provide a hardware root of trust that anchors device integrity, safeguards cryptographic keys, and enables secure boot processes. This blog explores how TPMs strengthen embedded systems, from their core architecture and advanced features to real-world applications in automotive, industrial, and IoT devices — and what engineers must consider to future-proof TPM security against emerging threats.
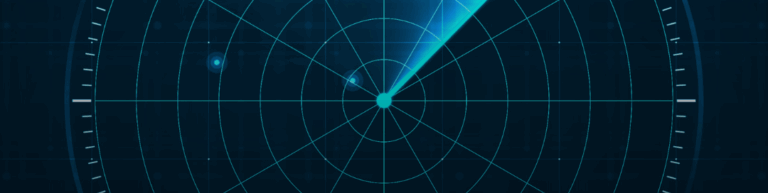
The Road to Autonomy: How Embedded Systems Drive Advanced Driver Assistance Systems (ADAS)
ADAS has evolved from simple, reactive driver aids into complex, real-time systems that interpret and anticipate road conditions. Powered by embedded systems, multi-modal sensors, and high-performance signal processing, modern ADAS delivers the safety and intelligence required for today’s vehicles. This blog explores the architectures, algorithms, and best practices behind ADAS innovation—and includes a white paper on designing cost-effective FPGA-based FMCW radar system
Custom FPGA Solutions for AI Acceleration in Embedded Applications
Custom FPGA solutions are unlocking new levels of AI acceleration at the edge. Learn how Fidus designs real-time, low-power inference engines for high-performance embedded systems—and what sets these architectures apart from off-the-shelf accelerators.